Calculus I 03.06 Curve Sketching
| Previous | Calculus I 03.05 Limits at Infinity |
| Next | Calculus I 03.07 Optimization Problems |
Contents
- 1 3.6 Curve Sketching Summary
- 1.1 Analyzing a Function's Graph
- 1.1.1 Guidelines for Analyzing Function Graphs
- 1.1.2 Example 3.6.1 Sketching the Graph for a Rational Function
- 1.1.3 Example 3.6.2 Sketching the Graph for a Rational Function
- 1.1.4 Example 3.6.3 Sketching the Graph for a Radical Function
- 1.1.5 Example 3.6.4 Sketching the Graph for a Radical Function
- 1.1.6 Example 3.6.5 Sketching the Graph for a Polynomial Function
- 1.1.7 Example 3.6.6 Sketching the Graph for a Trigonometric Function
- 1.1 Analyzing a Function's Graph
- 2 Internal Links
3.6 Curve Sketching Summary
- Analyze and sketch a function's graph.
Analyzing a Function's Graph
|
|
When sketching the graph for a function normally only a view is shown, not the entire graph. Which view to sketch crucial. For example, which view shown in Figure 3.6.1 better represents the graph for
The second view shows more interesting features. The \(x\)-intercept and a horizontal tangent line. But would a third view reveal other interesting features? To answer this use calculus to interpret the first and second derivatives. Below are guidelines for determining a good view for a graph. Guidelines for Analyzing Function GraphsDetermine the following for the function.
|
Example 3.6.1 Sketching the Graph for a Rational Function
|
|
Analyze and sketch the graph for
Solution Table 3.6.1 shows how the test intervals are used to determine the graph's characteristics, as shown in Figure 3.6.2.
Creating a table like Table 3.6.1, ensures all the characteristics and none are unaccounted for. | |||||||||||||||||||||||||||||||||||||||||||||
Example 3.6.2 Sketching the Graph for a Rational Function
|
|
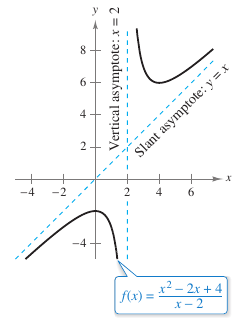
Analyze and sketch the graph for
Solution Table 3.6.2 shows how the test intervals are used to determine the graph's characteristics, as shown in Figure 3.6.3.
| |||||||||||||||||||||||||||||||||||||||||||||
|
|
Note the graph for \(f\) approaches the slant asymptote \(y=x\) as \(x\) approaches \(-\infty\) or \(\infty\). |
Example 3.6.3 Sketching the Graph for a Radical Function
|
|
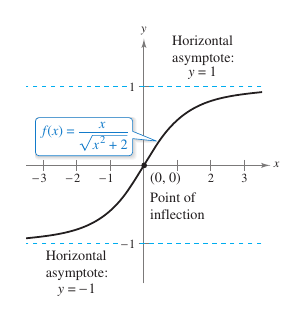
Analyze and sketch the graph for
Solution
The graph has only one intercept, \((0,0)\). It has no vertical asymptotes, but it has two horizontal asymptotes: \(y=1\), to the right, and \(y=-1\), to the left. The function has no critical numbers and one possible inflection point at \(x=0\). The function domain is all real numbers, and the graph is symmetric with respect to the origin. The analysis is shown in Table 3.6.3, and shown in Figure 3.6.3.
| |||||||||||||||||||||||||||||
Example 3.6.4 Sketching the Graph for a Radical Function
|
|
Analyze and sketch the graph for
Solution
The function has two intercepts, \((0,0)\) and \((\frac{125}{8},0)\). There are no horizontal or vertical asymptotes. The function has two critical numbers \(x=0\) and \(x=8\) and two possible inflection points at \(x=0\) and \(x=1\). The domain is all real numbers. The analysis is shown in Table 3.6.4, and shown in Figure 3.6.4.
| |||||||||||||||||||||||||||||||||||||||||||||||||
Example 3.6.5 Sketching the Graph for a Polynomial Function
|
|
Analyze and sketch the graph for
Solution Begin by factoring to obtain
Using the factored form for \(f(x)\) produces the following analysis. The analysis is shown in Table 3.6.5, and shown in Figure 3.6.7.
| |||||||||||||||||||||||||||||||||||||||||||||||||
The fourth-degree polynomial function in Example 3.6.5 has one relative minimum and no relative maxima. In general, a polynomial function with degree \(n\) can have at most \(n-1\) relative extrema, and at most \(n-2\) inflection points. Polynomial functions with even degree must have at least one relative extremum.
The “end behavior” for a polynomial function graph is determined by its leading coefficient and its degree. For example, because the polynomial in Example 3.6.5 has a positive leading coefficient, the graph rises to the right. Because the degree is even the graph also rises to the left.
Example 3.6.6 Sketching the Graph for a Trigonometric Function
|
|
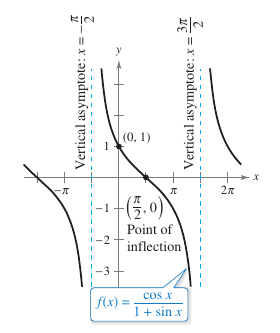
Analyze and sketch the graph for
Solution Because the function has a \(2\pi\) period restrict the analysis to any interval with length \(2\pi\). Here \((-\pi/2,3\pi/2)\) was chosen. The analysis is shown in Table 3.6.6, and shown in Figure 3.6.8.
By substituting \(-\pi/2\) or \(3\pi/2\) into function produces the form \(0/0\). This is called an indeterminate form which is described in Section 8.7. To determine that the function has vertical asymptotes at these two values, rewrite \(f\) as
In this form it is clear the graph for \(f\) has two vertical asymptotes at \(x=-\pi/2\) and \(x=3\pi/2\). | |||||||||||||||||||||||||||||||||||
Internal Links
Parent Article: Calculus I 03 Differentiation Applications


